Status Pages
Create public status pages to communicate service status with your customers. Includes real-time status, incident history, uptime metrics, email subscriptions, status badges, and Atom feeds.
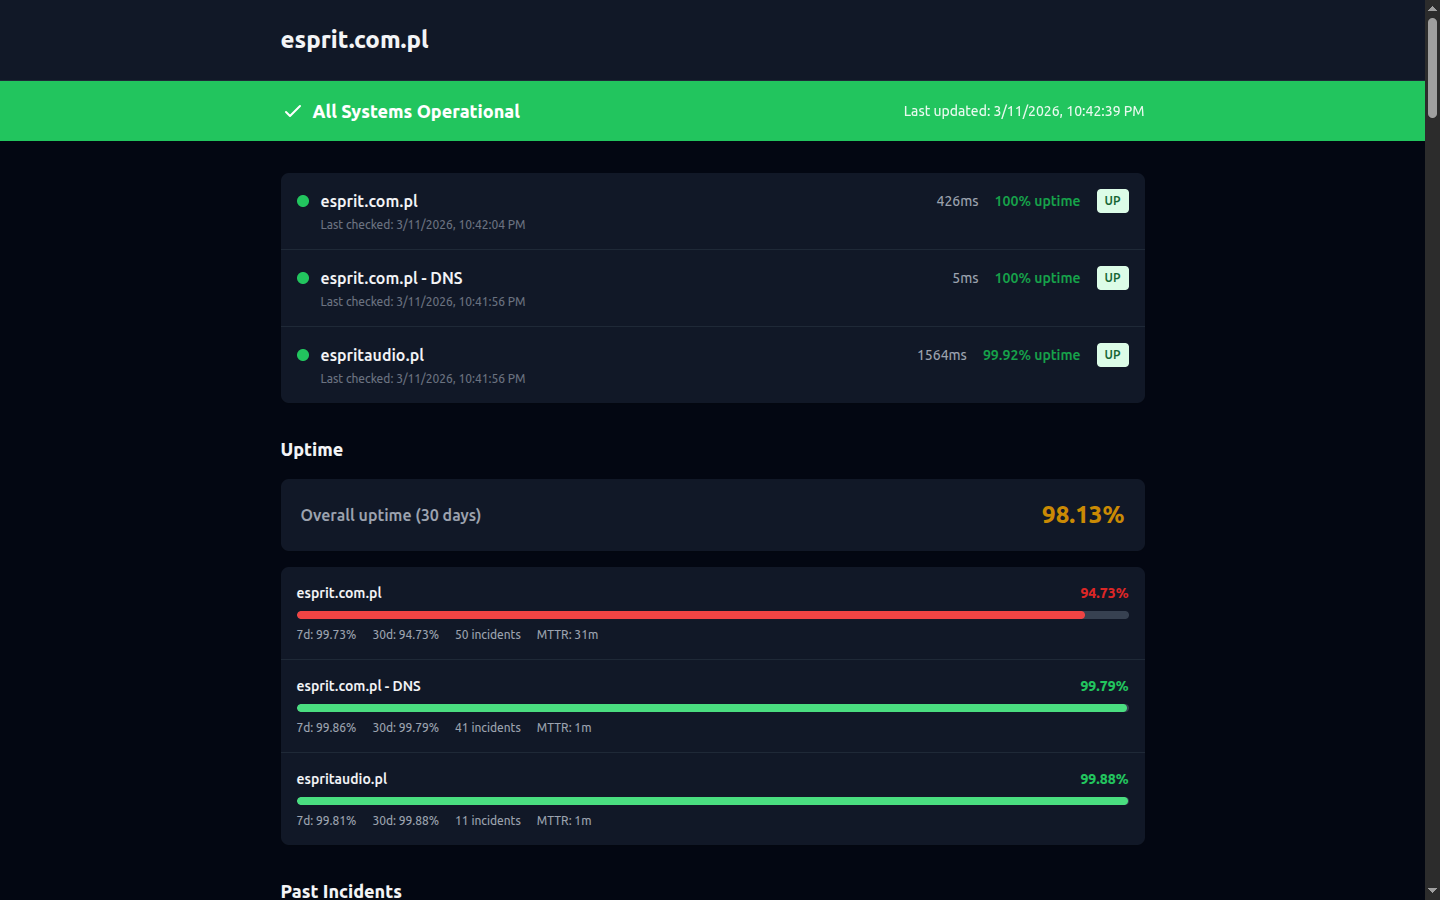
A public status page showing service status, uptime metrics, and incident history
Overview
Status pages provide a public-facing view of your service health. Customers can check the status of your services without needing to contact support. Key features:
- Public or private visibility
- Custom URL slug (e.g.,
/status/your-company) - Company branding with logo
- Real-time status updates
- 24-hour uptime percentage per check
- Clickable 90-day history bars per check
- 90-day incident history
- Email subscriptions for incident notifications
- SVG status badges for embedding
- Atom feed for RSS readers
- Downloadable status report
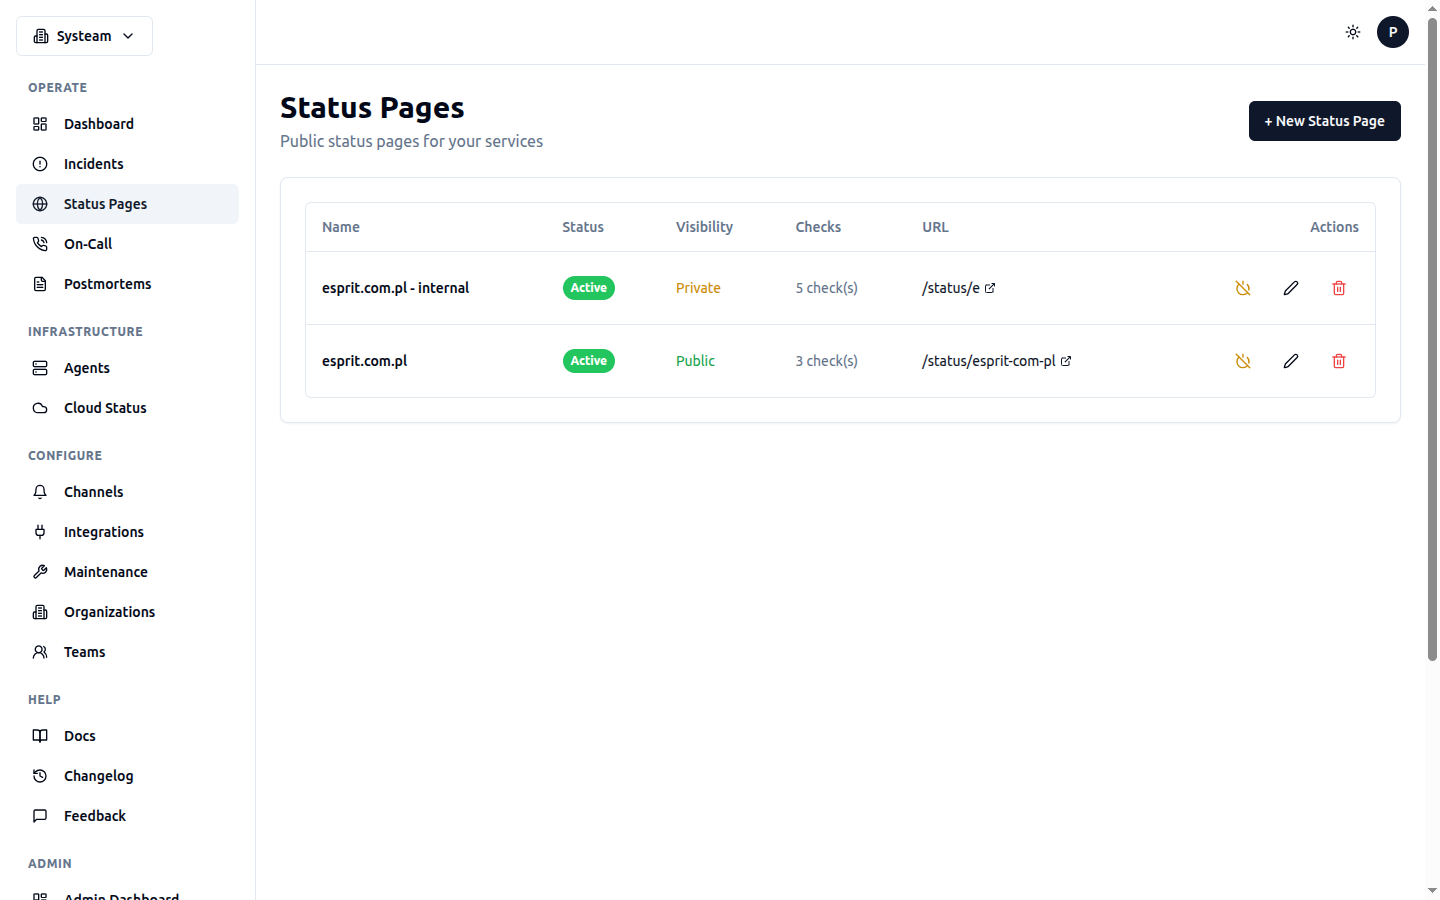
Manage your status pages with visibility controls, check assignments, and custom URLs
Creating a Status Page
- Go to Status Pages in the sidebar
- Click + New Status Page
- Configure the status page settings
- Select which checks to display
- Click Create
Example Configuration
Status Page URL
Once created, your status page is accessible at:
https://your-domain.com/status/{slug}

# Example:
https://your-domain.com/status/acme-corp
Overall Status
The status page shows an overall status based on all included checks:
90-Day History Bars
Each check on the status page shows a clickable 90-day history bar. Each day is colored by that day's uptime percentage:
- Green — Uptime ≥ 99.5%
- Yellow — Uptime ≥ 95%
- Red — Uptime below 95%
- Gray — No data (check was paused or new)
Hover over a day to see the exact uptime percentage and the worst state reached that day. Click any day that was not fully green to open what happened on that date — all the way back through the full 90 days, not just the recent ones. Green days have no incidents to show, so they are not clickable.
A day can be red with no status changes of its own — the check went down earlier and had not recovered yet, so nothing “happened” on that date. Those days are labelled Ongoing and point you at the day the incident actually started.
Inbound Incidents on Status Pages
Status pages can also reflect incidents created through the Inbound Events API (Prometheus, Grafana, custom scripts, etc.), not just your monitored checks.
Enabling It
This is opt-in per status page. In the status page editor, enable Show Inbound Incidents and choose a Minimum Severity (critical, error, warning, or info; default critical). Only inbound incidents at or above that severity are published.
Status Auto-Sync
Once enabled, the status page entry tracks the inbound incident automatically:
| Inbound event | Status page state |
|---|---|
| Incident created (trigger) | Investigating |
| Incident acknowledged | Identified |
| Incident resolved | Resolved |
A prominent active incidents banner appears at the top of the public page while any inbound incident is open. Subscribers get an email when the incident is first published and when it resolves — intermediate status changes update the page but don't generate additional emails, to avoid spamming subscribers.
Uptime Panel
Each check on the status page shows its 24-hour uptime percentage and current response time. This gives visitors a quick sense of service reliability.
Email Subscriptions
Visitors can subscribe to email notifications for your status page. When an incident occurs or resolves, subscribers automatically receive an email.
How It Works
- A visitor enters their email address in the subscribe form on your status page
- They receive a confirmation email with a verification link
- After clicking the link, they're subscribed to incident notifications
- When a check changes status (UP → DOWN, DOWN → UP, etc.), subscribers are notified
- Every notification email includes an unsubscribe link
Tip
Subscriptions use double opt-in (email confirmation required) to prevent spam and comply with email best practices. Unconfirmed subscriptions are automatically cleaned up.
What Subscribers Receive
- Incident notifications — When a check goes DOWN or DEGRADED
- Resolution notifications — When a check recovers to UP
- Notifications include: check name, old status, new status, timestamp
Status Badges
Embed status badges in your README, documentation, or website to show current service status. Badges are SVG images rendered in the shields.io style.
Badge Types
| Badge | URL | Shows |
|---|---|---|
| Status | /api/badges/{uuid} | Current status: UP (green), DOWN (red), DEGRADED (amber) |
| Uptime | /api/badges/{uuid}/uptime | 24-hour uptime percentage (e.g., "99.95%") |
Embedding
Embed codes are available on each check's detail page. Both Markdown and HTML formats are provided:

<img src="https://your-domain.com/api/badges/abc-123-uuid" alt="Status" />
<img src="https://your-domain.com/api/badges/abc-123-uuid/uptime" alt="Uptime" />
Customization
Badges support query parameters for styling:
| Parameter | Values | Default |
|---|---|---|
style | flat, flat-square | flat |
Badges are public and require no authentication. They are cached for a short period to reduce load.
Atom Feed
Every public status page has an Atom feed that RSS readers can subscribe to. This provides another way for your users to stay informed about incidents.
Feed URLs
| Feed | URL | Content |
|---|---|---|
| Main Feed | /api/status-pages/public/{slug}/feed.atom | All status changes and incidents |
| Incidents Feed | /api/status-pages/public/{slug}/incidents | Incident history only |
Add the Atom feed URL to any RSS reader (Feedly, Inoreader, Thunderbird, etc.) to receive updates automatically.
Custom Domains
Host your status page on your own domain (e.g., status.acme.com) instead of the default your-instance.com/status/slug URL.
Setup Steps
- Add a CNAME record pointing your subdomain to
syschecks.com(or your instance hostname) - Add a TXT record for domain verification:
_systeam-verify.status.acme.comwith the verification token shown in settings - In your status page settings, enter the custom domain and click Verify Domain
- Wait for DNS propagation (up to a few minutes)
- Click Check Status to confirm verification
DNS Records Example
| Type | Name | Value |
|---|---|---|
| CNAME | status.acme.com | syschecks.com |
| TXT | _systeam-verify.status.acme.com | systeam-verify-abc123... |
Tip
Verification States
| State | Meaning |
|---|---|
| Pending | Domain entered but DNS records not yet verified |
| Verified | Both CNAME and TXT records confirmed, custom domain is active |
| Failed | DNS records not found or incorrect. Check your DNS configuration. |
Public Report Download
Visitors can download a status report from your public status page. The report includes overall status, per-check uptime, and recent incident history. See the Reports page for more details.
Visibility Options
Public Status Pages
Accessible to anyone with the URL. No login required. Ideal for customer-facing status pages. Public pages also enable:
- Email subscriptions
- Atom feed
- Public report download
- Public API access
Private Status Pages
Require authentication. Use for internal team status pages or staging environments. Private pages are only visible to organization members.
Customization
Logo
Add your company logo URL to brand your status page. Recommended: height of 40-60 pixels.
Check Selection
Choose which checks to display. You can give checks different display names for the public page. For example, show "API" publicly while the internal check name is "Production API v2 - Load Balancer".
Best Practice
Group related services logically. Show "API" and "Website" but keep internal services like "Redis Cache" hidden from public view.
Managing Status Pages
Enable/Disable
Temporarily disable a status page without deleting it. Disabled pages return a 404 error.
Edit
Update the name, description, checks, or visibility settings at any time.
Delete
Permanently remove a status page and all its subscriber data. This cannot be undone.
Public API
Access status page data programmatically (no authentication required for public pages):
/api/status-pages/public/{slug}Status page data/api/status-pages/public/{slug}/uptimeUptime data for all checks/api/status-pages/public/{slug}/subscribeSubscribe to email notifications/api/status-pages/public/{slug}/feed.atomAtom feed{
"name": "Acme Corp Status",
"description": "Current status of Acme Corp services",
"logo_url": "https://acme.com/logo.png",
"overall_status": "operational",
"checks": [
{
"name": "API",
"status": "UP",
"response_time": 120,
"uptime_24h": 99.98,
"last_check": "2026-02-12T10:30:00Z"
},
{
"name": "Website",
"status": "UP",
"response_time": 340,
"uptime_24h": 100,
"last_check": "2026-02-12T10:30:00Z"
}
],
"last_updated": "2026-02-12T10:30:00Z"
}